Metricbeat AWS Cloudwatch Agent Log-shipping
Metricbeat is a lightweight shipper that you can install on your servers to periodically collect metrics from the operating system and from services running on the server. Metricbeat takes the metrics and statistics that it collects and ships them to the output that you specify, such as Elasticsearch or Logstash.
Metricbeat is an Elastic Beat. It’s based on the libbeat framework. For more information, see the Beats Platform Reference.
After metricbeat installation enable metricbeat aws module
[root@elk ~]# metricbeat modules enable awsaws.yml requirements
[root@elk ~]# vim /etc/metricbeat/modules.d/aws.yml# BEGIN
- module: aws
period: 300s
access_key_id: 'awskey'
secret_access_key: 'password'
default_region: 'eu-south-1'
metricsets:
- cloudwatch
metrics:
- namespace: CWAgent
statistic: Average
metric_names: ["LogicalDisk % Free Space"]
dimensions:
- name: instance
value: "C:"
- name: InstanceId
value: i-instanceid
- name: ImageId
value: ami-imageid
- name: objectname
value: LogicalDisk
- name: InstanceType
value: m5.large
fields:
server: Servername
- module: aws
period: 300s
access_key_id: 'awskey'
secret_access_key: 'password'
default_region: 'me-south-1'
metricsets:
- cloudwatch
metrics:
- namespace: CWAgent
statistic: Average
metric_names: ["Memory % Committed Bytes In Use"]
dimensions:
- name: InstanceId
value: i-instanceid
- name: ImageId
value: ami-imageid
- name: objectname
value: Memory
- name: InstanceType
value: m5.large
fields:
server: Servername
#ENDMake sure metricbeat is running

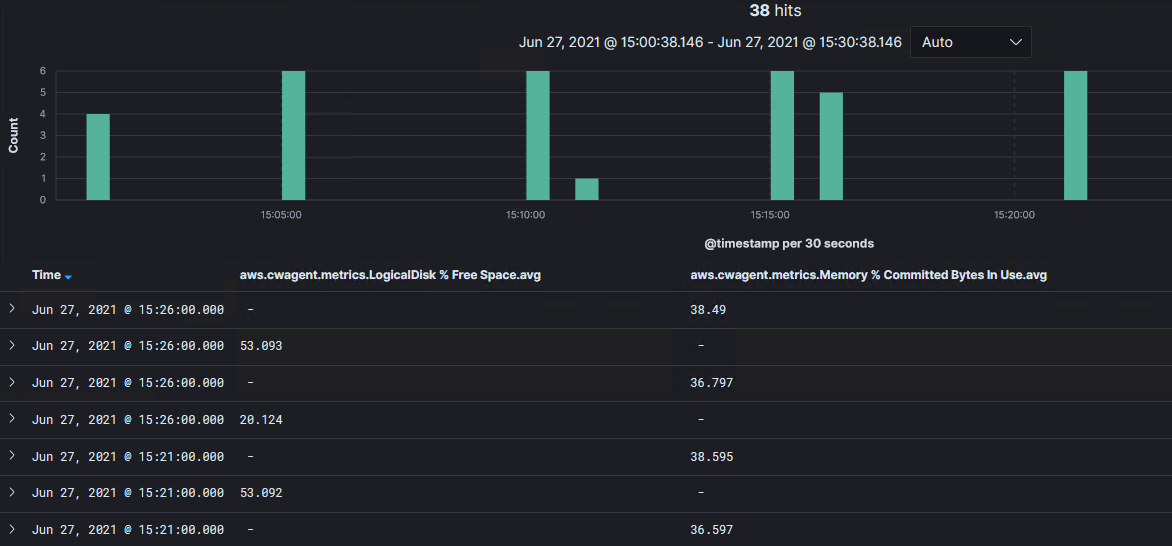
Make sure the kibana console is showing the logs
