Security Monitoring with WAZUH and ELK
Wazuh is a popular open source security detection, visibility, and compliance project which was born as a fork of OSSEC HIDS, and integrates with Elastic Stack as comprehensive open source SIEM solution. Wazuh works with different operating systems such as Linux, Windows, MacOS, Solaris and BSD alternatives. Wazuh can monitor a number of parameters on a host machine including logs, file integrity, rootkit detection, and Windows registry monitoring etc and can perform log analysis from other network services, including most of the popular open source FTP, mail, DNS, database, web, firewall, and network-based IDS solutions. The Wazuh project itself does not include a graphical user interface layer. One of the external visualization tools such as Kibana or Grafana must be used as GUI to Wazuh installation.
A Wazuh deployment consists of three main components:
The manager or the Wazuh server which is responsible for collecting the log data from the different data sources.
The agents are responsible for collecting and processing the logs and making them easier to analyze.
The data analytics tool with visualization such as Elasticstack.
Wazuh comes with a number of alerting options and can be used as part of automated intrusion detection or active response solutions. For log collection, Wazuh uses the legacy log storage engine of OSSEC. By default, log messages from host agents are rotated on daily basis unless a specific configuration is made in ht ossec.conf file.
Setting up Wazuh involves the installation of the Wazuh server with optional API package, Wazuh agents and the Elastic Stack. Wazuh server or Wazuh manager collects and analyzes data from deployed agents. Wazuh API setup the interface for communication between Wazuh manager and Kibana. Elastic Stack engine constists of Elasticsearch, Logstash and Kibana. It reads, parses, indexes, and stores alert data generated by the Wazuh server.
Wazuh agent runs on the monitored host, collecting system log and configuration data and detecting intrusions and anomalies. It talks with the Wazuh manager to which it forwards collected data for further analysis.
Wazuh deployment on Centos using YUM
Setting up the YUM repository
# cat > /etc/yum.repos.d/wazuh.repo <<\EOF
[wazuh_repo]
gpgcheck=1
gpgkey=https://packages.wazuh.com/key/GPG-KEY-WAZUH
enabled=1
name=Wazuh repository
baseurl=https://packages.wazuh.com/3.x/yum/
protect=1
EOF
Install the Wazuh Manager (Server)
[root@myhost alerts]# yum install wazuh-manager
[root@myhost alerts]# systemctl start wazuh-manager
Check the service status with
[root@myhost alerts]# systemctl status wazuh-manager
Install the Wazuh API
[root@myhost alerts]# yum install wazuh-api
[root@myhost alerts]# systemctl start wazuh-api
Check the Wazuh API service status with:
[root@myhost alerts]# systemctl status wazuh-api
Install the Wazuh Application for Kibana
[root@myhost alerts]# /usr/share/kibana/bin/kibana-plugin install https://packages.wazuh.com/wazuhapp/wazuhapp-3.2.2_6.2.4.zip
To install the Windows agent run the downloaded file and follow the steps in the installation wizard.
Agent management in the server
manage_agents binary from the bin folder of ossec installation is used to manage the agents
[root@myhost bin]# ./manage_agents
****************************************
* Wazuh v3.2.1 Agent manager. *
* The following options are available: *
****************************************
(A)dd an agent (A).
(E)xtract key for an agent (E).
(L)ist already added agents (L).
(R)emove an agent (R).
(Q)uit.
Choose your action: A,E,L,R or Q:
The logs sent to Wazuh manager is stored as text file into /var/ossec/logs/alerts folder as alerts.log file and parsed against the rules configured and stored into alerts.json file in JSON format.
[root@myhost alerts]# ls -l
total 483080
drwxr-x--- 4 ossec ossec 26 Dec 1 00:00 2017
drwxr-x--- 7 ossec ossec 56 May 1 00:00 2018
-rw-r----- 2 ossec ossec 246500680 May 22 09:04 alerts.json
-rw-r----- 2 ossec ossec 145358249 May 22 09:04 alerts.log
Logstash input configuration
input {
file {
type => "wazuh-alerts"
path => "/var/ossec/logs/alerts/alerts.json"
codec => "json"
}
}
Logstsh filter configuration (With optional geo-ip plugin )
if [type] in ["wazuh-alerts","Security","System","Application"]
{

if [data][srcip] {
mutate {
add_field => [ "@src_ip", "%{[data][srcip]}" ]
}
}

geoip {
source => "srcip"
target => "GeoLocation"
fields => ["city_name", "continent_code", "country_code2", "country_name", "region_name", "location"]
}
date {
match => ["timestamp", "ISO8601"]
target => "@timestamp"
}
mutate {
add_field => { "indexType" => "WAZUH-LOGS" }
remove_field => [ "timestamp", "beat", "fields", "input_type", "tags", "count", "@version", "log", "offset", "type"]
}
}
Logstash output configuration
else if [indexType] == "WAZUH-LOGS"
{
elasticsearch {
hosts => "http://localhost:9200"
index => "wazuh-alerts-3.x-%{+YYYY.MM.dd}"
document_type => "wazuh"
}
}
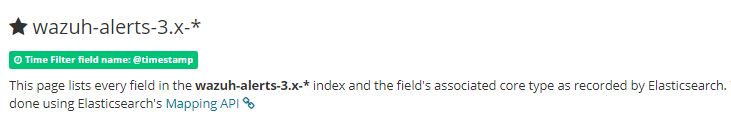
Create an index in Elastisearch using wazuh-alerts-3.x-* as pattern
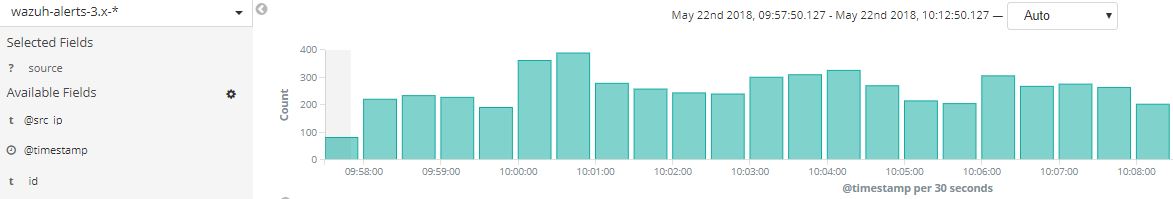
Wazuh logs in Kibana
Wazuh-Kibana app menu
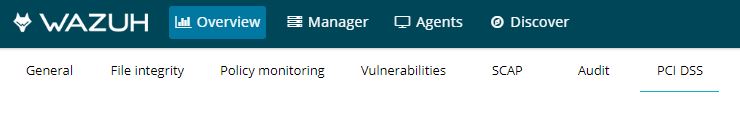
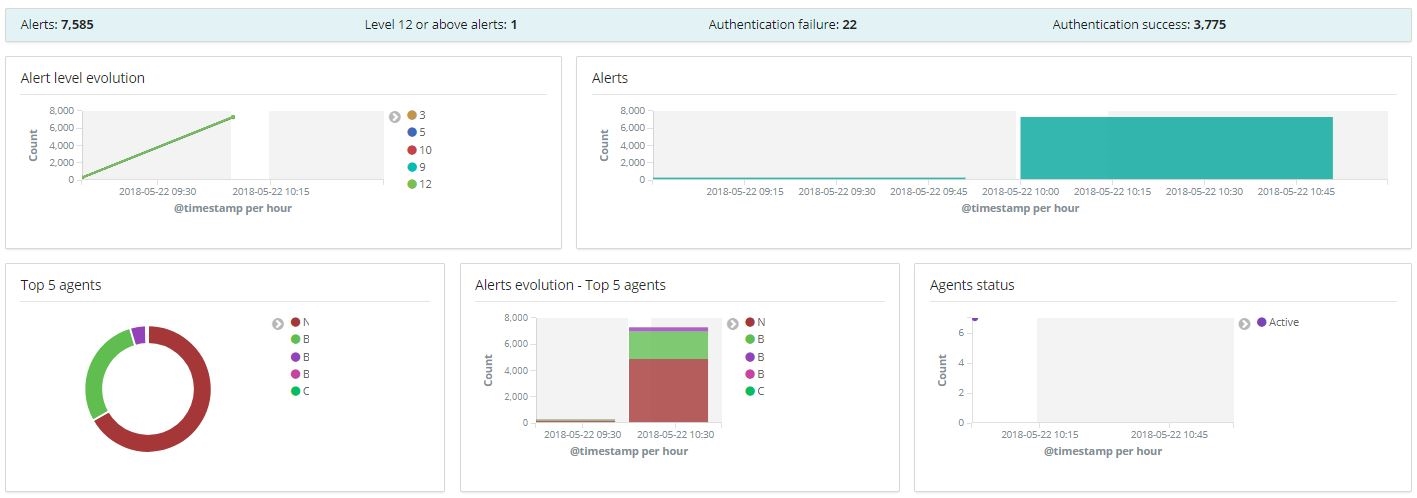
Visualizations in Wazuh-Kibana app dashboard
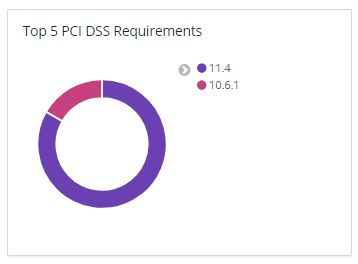
Compliance (PCI DSS)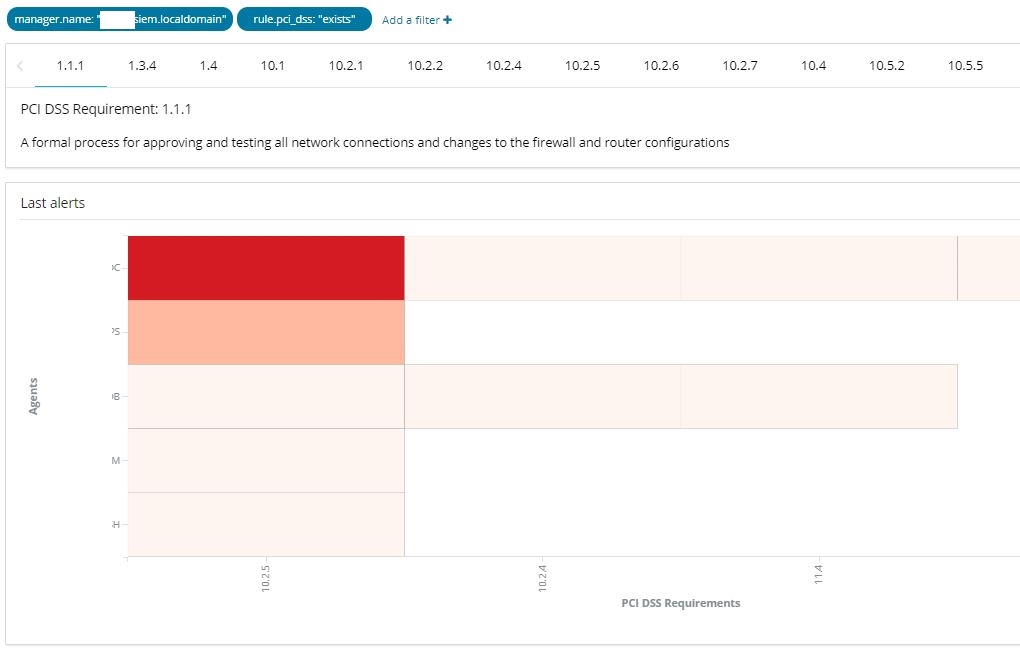
File integrity 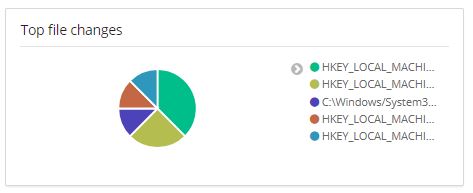
PCI DSS compliance requirement