IIS Log Analyzer using ELK
Logstash is a useful tool for processing log files that accept data from multiple sources and different formats. Logstash easly process text-based logs and send the data into databases like Elasticsearch. This post describes how setup IIS to write logs with the selected fields, and how to configure logstash to process them into Elasticsearch for analysis and visualization in Kibana.
IIS Server Configuration
Open IIS Manager, click on the server level on the left hand side and then click on Logging in the middle pane.
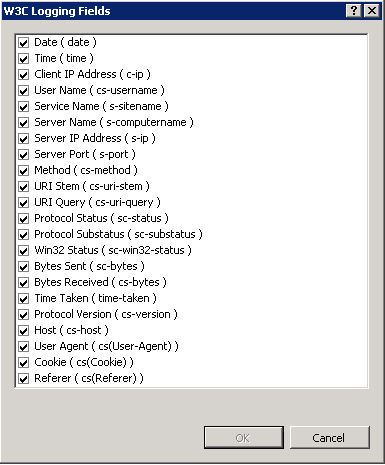
Under the Log File section leave the format as default W3C and click the Select Fields button.
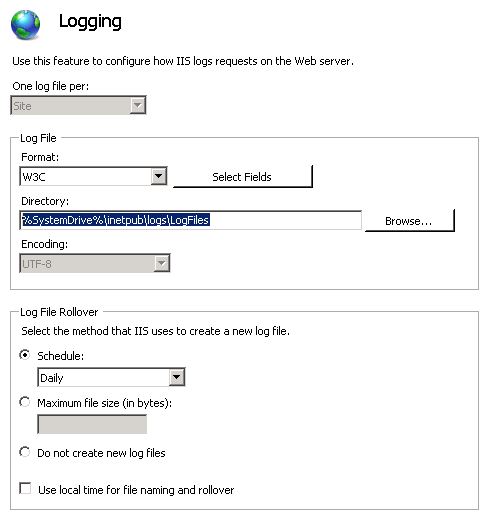
Make sure that ALL of the fields are selected. (In this example the Logstash Grok filter is configured such as way that all the fields are selected in IIS log settings. For custom log selection Grok filter must be modified accordingly)
Logstash Setup
Input configuration
input {
 beats {
    port => 5044
 }
}
Filter configuration
if [type]=="iis"
       {
       grok {
          break_on_match => false
          match => { "message" => "%{TIMESTAMP_ISO8601:log_timestamp} %{WORD:S-SiteName} %{NOTSPACE:S-ComputerName} %{IPORHOST:S-IP} %{WORD:CS-Method} %{URIPATH:CS-URI-Stem} (?:-|\"%{URIPATH:CS-URI-Query}\") %{NUMBER:S-Port} %{NOTSPACE:CS-Username} %{IPORHOST:C-IP} %{NOTSPACE:CS-Version} %{NOTSPACE:CS-UserAgent} %{NOTSPACE:CS-Cookie} %{NOTSPACE:CS-Referer} %{NOTSPACE:CS-Host} %{NUMBER:SC-Status} %{NUMBER:SC-SubStatus} %{NUMBER:SC-Win32-Status} %{NUMBER:SC-Bytes} %{NUMBER:CS-Bytes} %{NUMBER:Time-Taken}"}
           }
       mutate { add_field => { "indexType" => "IIS-LOGS" }}
       }
Output configuration
if [indexType] == "IIS-LOGS"
{
elasticsearch {
    hosts => "http://elasticsearchip:9200"
    index => "iis-logs-%{+YYYY.MM.dd}"
    document_type => doc
    }
}
Restart Logstash service after modifying the configuration files.
Filebeat installation
Download the Filebeat Windows zip file from the Elastic downloads page.
Extract the contents of the zip file into C:\Program Files.
Open a PowerShell prompt as an Administrator
Navigate to the folder where the zip file is extracted
Run the following commands to install Filebeat as a Windows service:
PS C:\Program Files\extractedfilebeatfolder> .\install-service-filebeat.ps1
Open the filebeat.yml configuration file located in the Filebeat installation directory
Set the document_type and path values as below
#=========================== Filebeat prospectors =============================
filebeat.prospectors:
# Each - is a prospector. Most options can be set at the prospector level, so
# you can use different prospectors for various configurations.
# Below are the prospector specific configurations.
- input_type: log
 # Paths that should be crawled and fetched. Glob based paths.
 paths:
    - C:\inetpub\logs\LogFiles\*\*
 document_type : iis
    #- c:\programdata\elasticsearch\logs\*
Here I am forwarding the logs to Logstash input
#----------------------------- Logstash output --------------------------------
output.logstash:
 # The Logstash hosts
 hosts: ["172.16.12.10:5044"]
Save the file and restart the Filebeat service.
Kibana Setup
In Kibana create an index to retrieve data from Elasticsearch indices with the pattern “iis-logs-*”
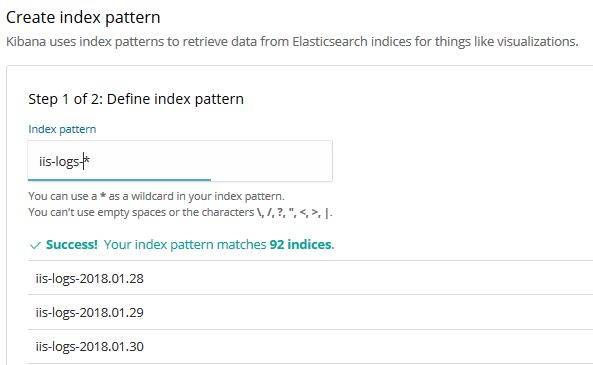
Once the index is created you can use it for search and creating visualizations.

